
Planning
The Gantt Chart
The activities have been managed dividing the whole work into three macro-sections and scheduling the three reviews as checkpoints for each of them.
A Gantt chart has been produced as a guideline to be followed in order to get optimal results. Its description has been detailed in the following section
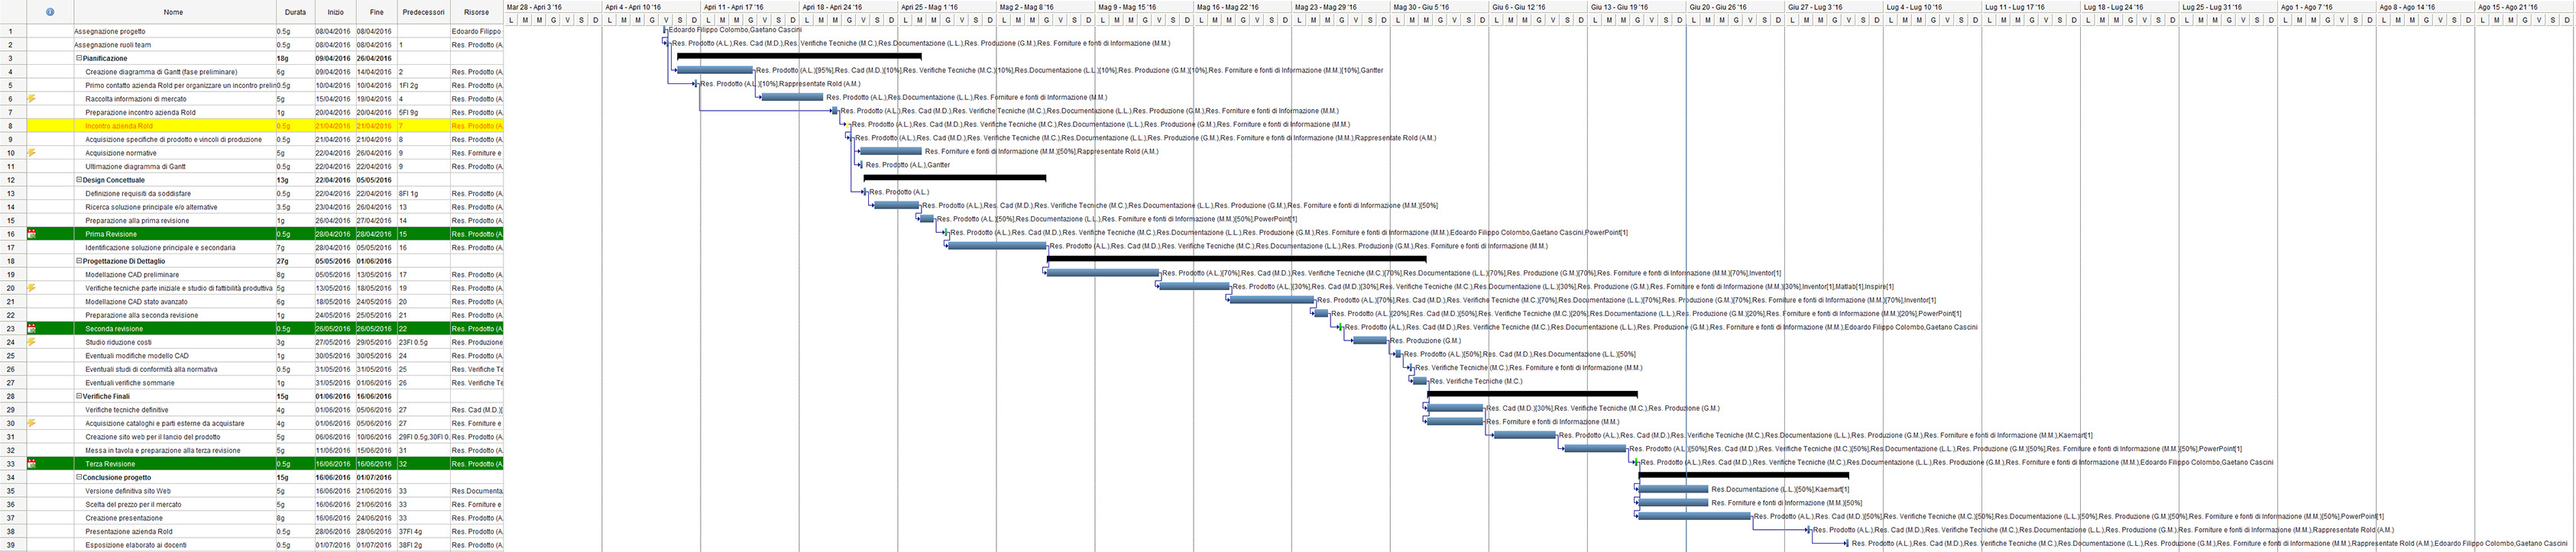
Gantt Chart
(The complete Gantt chart)
The initial section, characterized by information gathering, with basical analysis to deal with the project and a problem-solving activity, has been the most abstract.
The whole team partecipated in this phase, limiting the indvidual work, in order to let every member appreciate every shade of the project and its hidden dangers.
The following section has been based on the production of the CAD models. Partial analysis for both the productive and technical sectors haven't been forgotten. By doing this, every manager has been able to coordinate the works so that they could be brought to an end in a few days, taking advantage of the team capabilities.
The final section has been conceived with a schedule aimed to reduce as much as possible the errors, since time to correct errors wouldn't have been much.
With this thinking, in every crucial choice, no manager has been left alone but has always had at least one other member of the team to confront with, establishing a sort of internal advicing activity.
The conclusion of the project has been scheduled through the end of June, so that the last delicate procedures wouldn't overlap the tasks bound to the universitary courses of the different team members.
Laboratorio Progettuale CAD - Academic year 2015-2016
